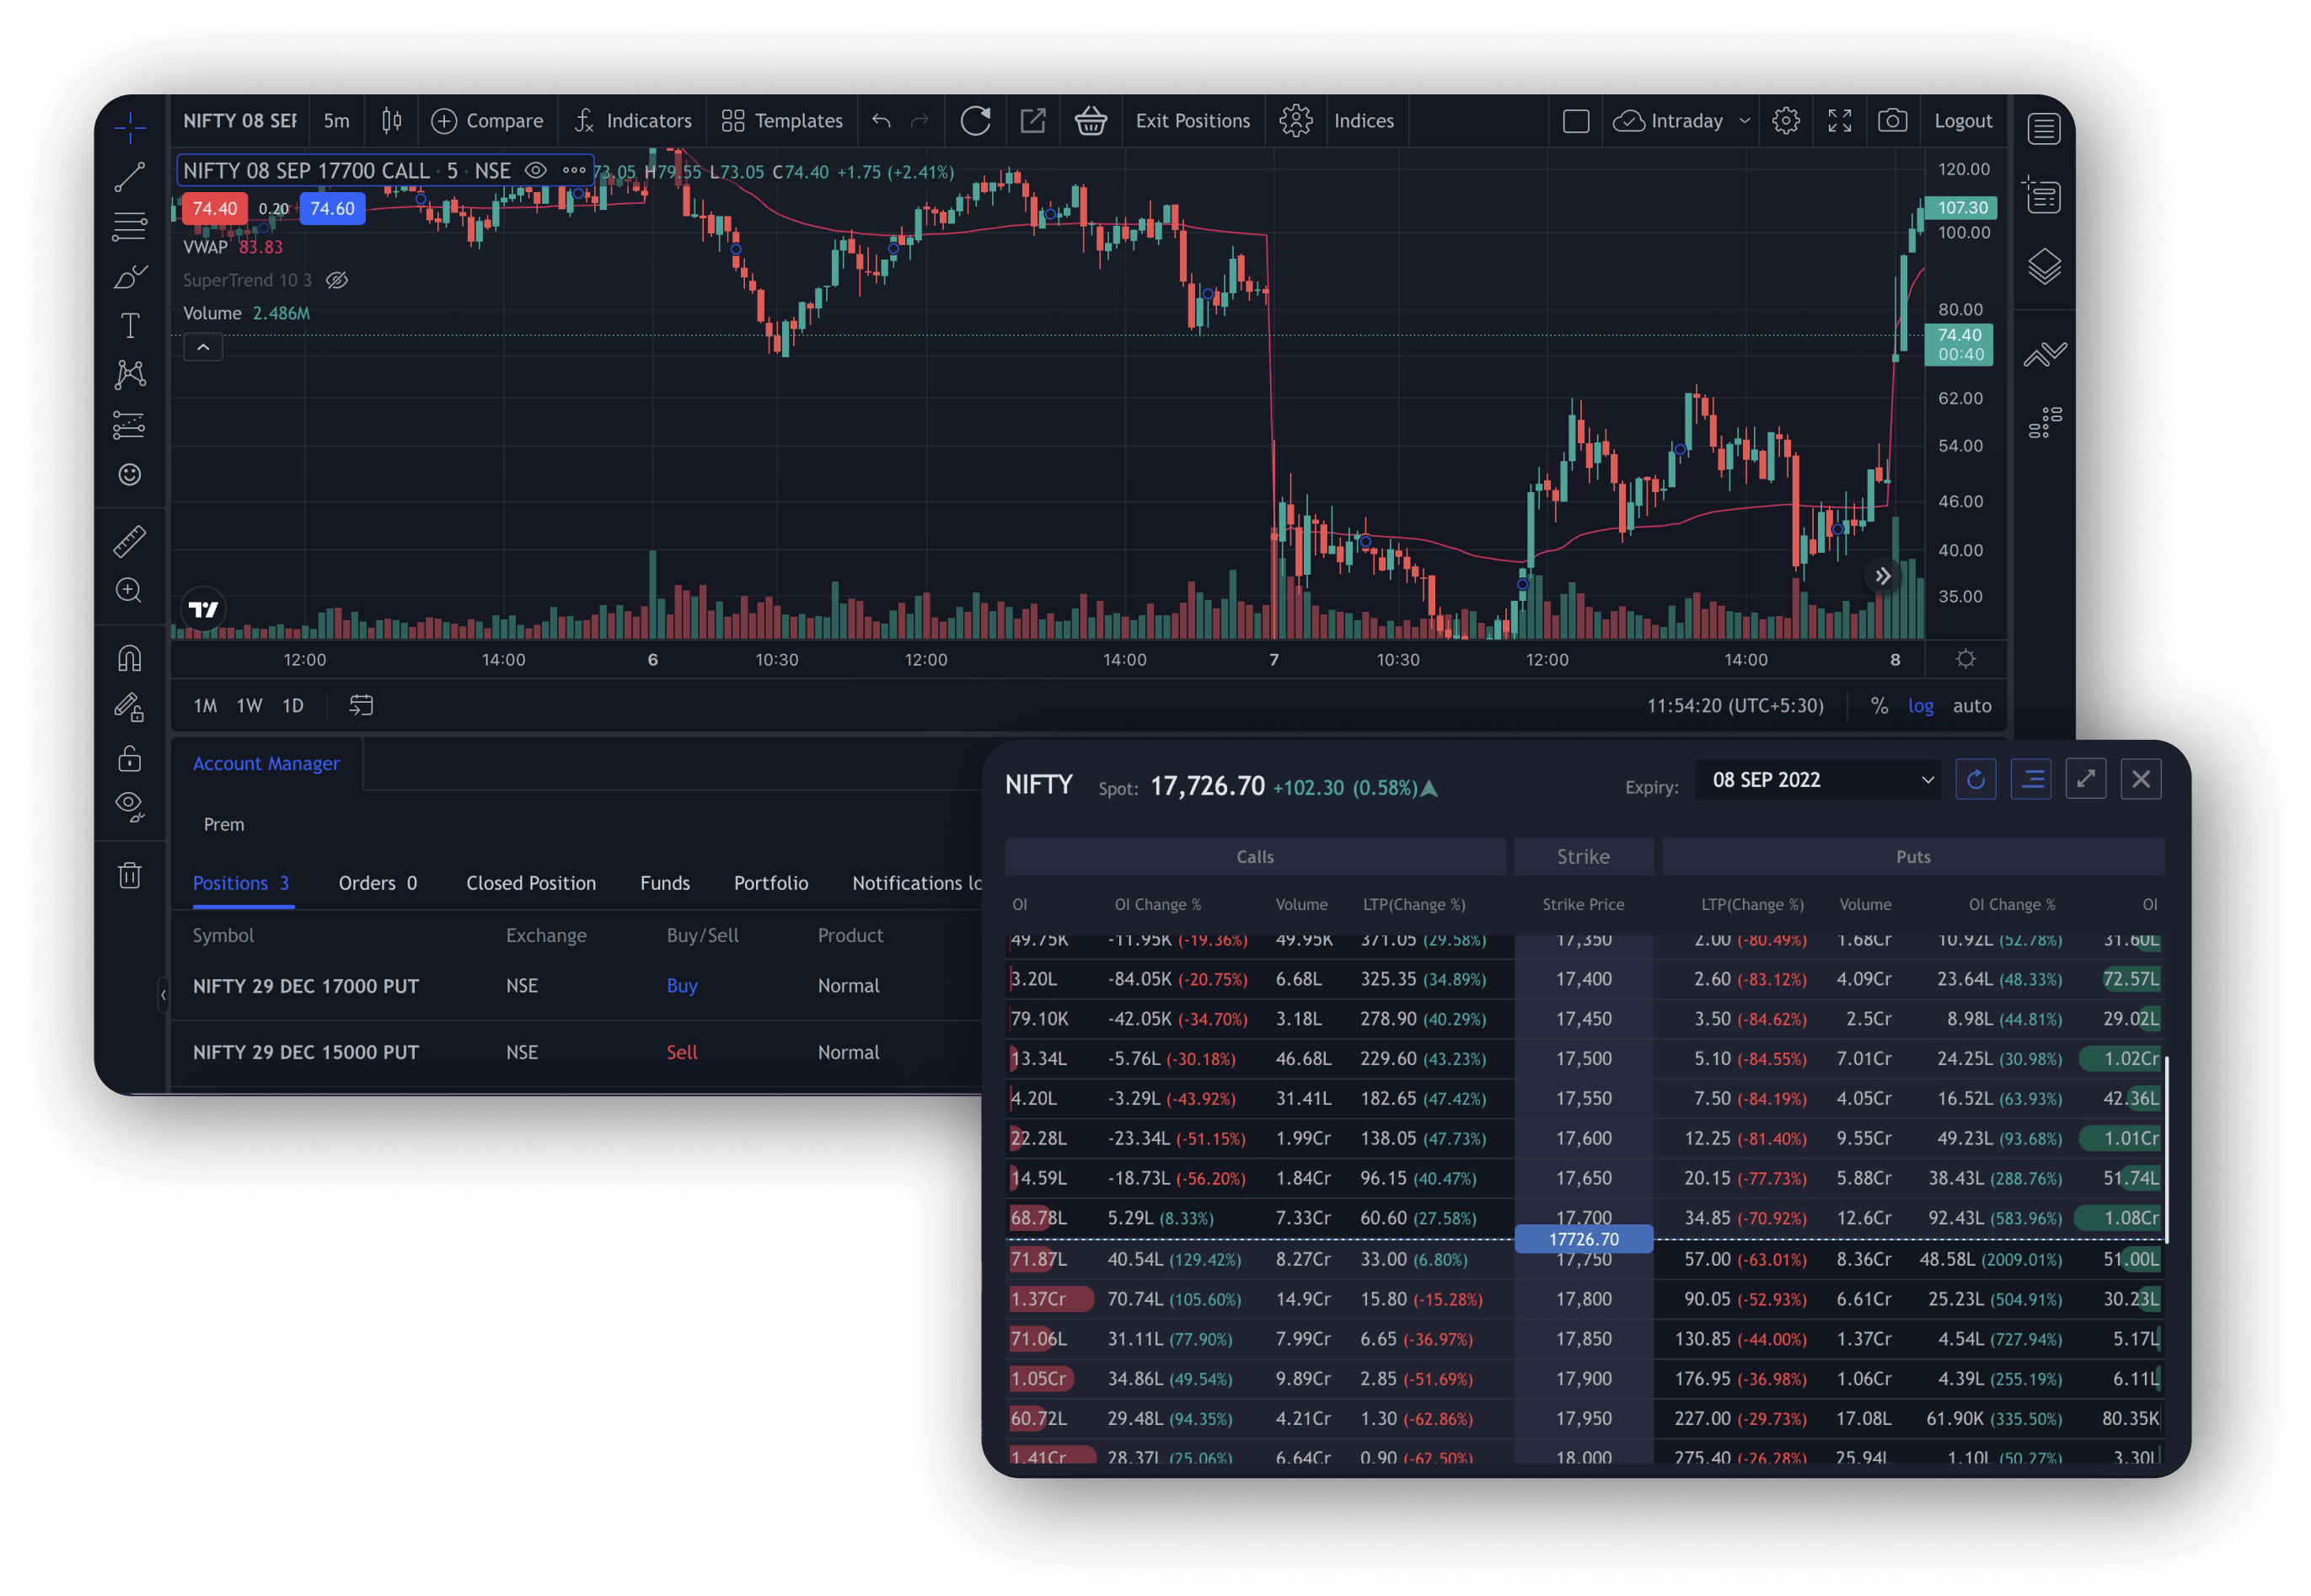
Stock trading is a popular investment option that offers an opportunity to earn profits by buying and selling stocks in a company. The stock market is dynamic and changes frequently, making it essential to have a reliable stock analysis tool. In this guide, we will discuss how to use TradingView Charts to master stock trading.
Overview of TradingView Charts and their Features
TradingView Charts is a popular stock analysis tool used by traders and investors worldwide. It is a web-based platform designed to provide real-time data, advanced charting tools, and trading ideas. The platform has a variety of features designed to help traders make informed decisions when buying and selling stocks.
One of the essential features of TradingView Chart is customizable charts. The charts can be personalized to suit trader requirements. The charts offer various timeframes, ranging from one-minute to monthly charts. Additionally, TradingView Charts provide features such as drawing tools, indicators, and overlays that can be used to analyze and identify patterns and trends in market data.
How to use TradingView Charts for stock analysis
TradingView Charts offers advanced tools for stock analysis that help traders make informed decisions when buying or selling stocks. Here are some of the basic functionalities of TradingView Charts used for stock analysis.
Basic functionalities and customization options in TradingView Charts
TradingView Charts offer several customization options to personalize the charts to trader preferences. Customization options include chart type, color schemes, timeframes, and chart layout. Additionally, traders can pin their favorite chart layouts and settings for later use.
Traders can also use the straightforward navigation menu to toggle between the chart and the stock’s financial data. Financial data includes fundamental data, news, and research reports that can be used to make informed trading decisions.
Technical analysis tools and indicators are available in TradingView Charts
TradingView Charts offers a vast array of technical analysis tools and indicators traders can use to identify trends and patterns in market data. Some of the commonly used tools include moving averages, Bollinger Bands, MACD, and RSI.
Studying technical charts, identifying support and resistance levels, and identifying trends require the use of technical analysis tools. Additionally, traders can use TradingView Chart indicators to create custom indicators and alert systems.


